Using zea.Models: a UNet example
In this notebook, we demonstrate how to use the zea.Models interface with a popular deep learning architecture: the UNet. We’ll use a pretrained UNet to inpaint missing regions in ultrasound images, and visualize the results. This workflow can be adapted for other tasks and models in the zea toolbox.
![]()
[ ]:
%%capture
%pip install zea
[2]:
import os

os.environ["KERAS_BACKEND"] = "jax"
os.environ["TF_CPP_MIN_LOG_LEVEL"] = "3"
[3]:
import matplotlib.pyplot as plt
from keras import ops

from zea import init_device, log
from zea.backend.tensorflow.dataloader import make_dataloader
from zea.models.unet import UNet
from zea.models.lpips import LPIPS
from zea.agent.masks import random_uniform_lines
from zea.visualize import plot_image_grid, set_mpl_style
zea: Using backend 'jax'
We will work with the GPU if available, and initialize using init_device to pick the best available device. Also, (optionally), we will set the matplotlib style for plotting.
[4]:
device = init_device(verbose=False)
set_mpl_style()
Load Data
We load a small batch from the CAMUS validation dataset hosted on Hugging Face Hub.
[5]:
n_imgs = 8

val_dataset = make_dataloader(
    "hf://zeahub/camus-sample/val",
    key="data/image",
    batch_size=n_imgs,
    shuffle=True,
    image_size=[128, 128],
    resize_type="resize",
    image_range=[-60, 0],
    normalization_range=[-1, 1],
    seed=42,
)
batch = next(iter(val_dataset))
batch = ops.clip(batch, -1, 1)
zea: Using pregenerated dataset info file: /home/devcontainer15/.cache/zea/huggingface/datasets/datasets--zeahub--camus-sample/snapshots/617cf91a1267b5ffbcfafe9bebf0813c7cee8493/val/dataset_info.yaml ...
zea: ...for reading file paths in /home/devcontainer15/.cache/zea/huggingface/datasets/datasets--zeahub--camus-sample/snapshots/617cf91a1267b5ffbcfafe9bebf0813c7cee8493/val
zea: Dataset was validated on June 15, 2025
zea: Remove /home/devcontainer15/.cache/zea/huggingface/datasets/datasets--zeahub--camus-sample/snapshots/617cf91a1267b5ffbcfafe9bebf0813c7cee8493/val/validated.flag if you want to redo validation.
zea: WARNING H5Generator: Not all files have the same shape. This can lead to issues when resizing images later....
zea: H5Generator: Shuffled data.
zea: H5Generator: Shuffled data.
Load UNet Model
We use a pretrained UNet model from zea for inpainting.
[6]:
presets = list(UNet.presets.keys())
log.info(f"Available built-in zea presets for UNet: {presets}")

model = UNet.from_preset("unet-echonet-inpainter")
zea: Available built-in zea presets for UNet: ['unet-echonet-inpainter']
Simulate Missing Data
We simulate missing data by masking out random columns in each image (e.g., 75% missing). This is a common scenario in cognitive ultrasound where some scanlines may be missing (i.e. not acquired) or corrupted.
[7]:
n_columns = 128  # batch.shape[2]
mask = random_uniform_lines(n_columns // 4, n_columns, n_imgs)
corrupted = batch * ops.cast(mask[:, None, :, None], batch.dtype)
Inpaint with UNet
We use the UNet to inpaint the missing regions.
[8]:
inpainted = model(corrupted)
inpainted = ops.clip(inpainted, -1, 1)
Evaluate Perceptual Similarity
We use the LPIPS metric to evaluate perceptual similarity between the ground truth and inpainted images. For more detailed example of this metric, see this notebook.
[9]:
lpips = LPIPS.from_preset("lpips")
lpips_scores = lpips([inpainted, inpainted])
lpips_scores = ops.convert_to_numpy(lpips_scores)
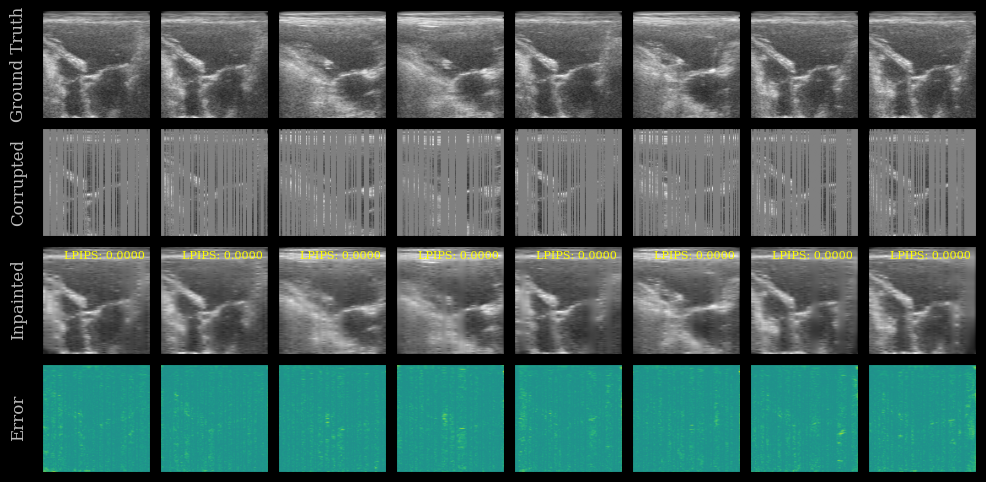
Visualization
We plot the ground truth, corrupted, inpainted, and error images. The LPIPS score is shown on each inpainted image. Note that this model was trained on the EchoNet-Dynamic dataset, whereas we are testing now on the CAMUS dataset.
[10]:
error = ops.abs(batch - inpainted)
imgs = ops.concatenate([batch, corrupted, inpainted, error], axis=0)
imgs = ops.convert_to_numpy(imgs)

cmaps = ["gray"] * (3 * n_imgs) + ["viridis"] * n_imgs

fig, _ = plot_image_grid(
    imgs,
    vmin=-1,
    vmax=1,
    ncols=n_imgs,
    remove_axis=False,
    cmap=cmaps,
    figsize=(n_imgs * 2, 6),
)

titles = ["Ground Truth", "Corrupted", "Inpainted", "Error"]
for i, ax in enumerate(fig.axes[: len(titles) * n_imgs]):
    if i % n_imgs == 0:
        ax.set_ylabel(titles[i // n_imgs])

# Show LPIPS score on each inpainted image
for ax, lpips_score in zip(fig.axes[n_imgs * 2 : 3 * n_imgs], lpips_scores):
    ax.text(
        0.95,
        0.95,
        f"LPIPS: {float(lpips_score):.4f}",
        ha="right",
        va="top",
        transform=ax.transAxes,
        fontsize=8,
        color="yellow",
    )
plt.show()
You can try other UNet presets or experiment with different masking strategies to explore the capabilities of zea.Models!