LPIPS: Perceptual Similarity for Ultrasound Images
Assessment of ultrasound image quality is one of the more notorious challenges. zea offers a variety of commonly used metrics in zea.metrics. In this notebook, we demonstrate how to use the LPIPS model to compute perceptual similarity between ultrasound images using the zea toolbox. Besides common distortion metrics, a perceptual metric can be a good complementary metric to assess image quality. For more info, see an interesting
paper called: The Perception-Distortion Tradeoff. First we’ll set an appropriate backend for Keras.
![]()
[ ]:
%%capture
%pip install zea
[1]:
import os

os.environ["KERAS_BACKEND"] = "jax"
os.environ["TF_CPP_MIN_LOG_LEVEL"] = "3"
[2]:
import matplotlib.pyplot as plt
import numpy as np
from keras import ops

from zea import init_device
from zea.backend.tensorflow.dataloader import make_dataloader
from zea.models.lpips import LPIPS
from zea.visualize import plot_image_grid, set_mpl_style
zea: Using backend 'jax'
We will work with the GPU if available, and initialize using init_device to pick the best available device. Also, (optionally), we will set the matplotlib style for plotting.
[3]:
init_device(verbose=False)
set_mpl_style()
Load data
We load a small batch from the CAMUS validation dataset hosted on Hugging Face Hub.
[4]:
n_imgs = 9
val_dataset = make_dataloader(
    "hf://zeahub/camus-sample/val",
    key="data/image",
    batch_size=n_imgs,
    shuffle=True,
    image_size=[256, 256],
    resize_type="resize",
    image_range=[-60, 0],
    normalization_range=[-1, 1],
    seed=42,
)
zea: Using pregenerated dataset info file: /home/devcontainer15/.cache/zea/huggingface/datasets/datasets--zeahub--camus-sample/snapshots/617cf91a1267b5ffbcfafe9bebf0813c7cee8493/val/dataset_info.yaml ...
zea: ...for reading file paths in /home/devcontainer15/.cache/zea/huggingface/datasets/datasets--zeahub--camus-sample/snapshots/617cf91a1267b5ffbcfafe9bebf0813c7cee8493/val
zea: Dataset was validated on June 13, 2025
zea: Remove /home/devcontainer15/.cache/zea/huggingface/datasets/datasets--zeahub--camus-sample/snapshots/617cf91a1267b5ffbcfafe9bebf0813c7cee8493/val/validated.flag if you want to redo validation.
zea: WARNING H5Generator: Not all files have the same shape. This can lead to issues when resizing images later....
zea: H5Generator: Shuffled data.
Load LPIPS Model
We use the built-in LPIPS model from zea.
[5]:
model = LPIPS.from_preset("lpips")
We select one image as the reference and the rest as example images. LPIPS expects RGB images, so we tile the grayscale images to 3 channels.
[6]:
batch = next(iter(val_dataset))

reference_image = batch[0]
example_images = batch[1:]
zea: H5Generator: Shuffled data.
Compute LPIPS Similarity
We compute the LPIPS similarity between the reference image and each example image.
[7]:
lpips_scores = []
for example_image in example_images:
    score = model((reference_image, example_image))
    lpips_scores.append(score)
lpips_scores = ops.concatenate(lpips_scores, axis=0)
lpips_scores = ops.convert_to_numpy(lpips_scores)
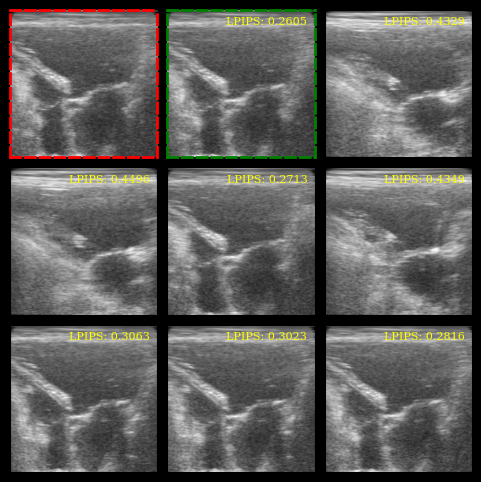
Visualization
We plot the images, highlight the reference (red border) and the most similar image (green border), and display the LPIPS scores.
[8]:
batch_np = ops.convert_to_numpy(batch)
batch_np = ((batch_np + 1) / 2 * 255).astype(np.uint8)

fig, _ = plot_image_grid(batch_np, remove_axis=False)
axes = fig.axes[:n_imgs]

# Red border for reference image
for spine in axes[0].spines.values():
    spine.set_edgecolor("red")
    spine.set_linewidth(2)
    spine.set_linestyle("--")

# Green border for most similar image
most_similar_idx = lpips_scores.argmin()
for spine in axes[most_similar_idx + 1].spines.values():
    spine.set_edgecolor("green")
    spine.set_linewidth(2)
    spine.set_linestyle("--")

# LPIPS scores as text
for ax, lpips_score in zip(axes[1:], lpips_scores):
    ax.text(
        0.95,
        0.95,
        f"LPIPS: {float(lpips_score):.4f}",
        ha="right",
        va="top",
        transform=ax.transAxes,
        fontsize=8,
        color="yellow",
    )
plt.show()